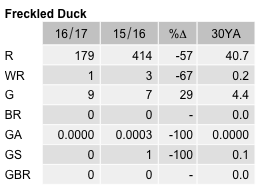
Freckled Duck
Stictonetta naevosa
ABR description
The following is extracted from the Annual Bird Report for the twelve months to June 2017.
Uncommon, non-breeding visitor
Declared vulnerable in New South Wales
General: When compared with the high of 5442 birds reported in 2013-14, numbers have decreased considerably (1356) and down from previous year. The low number reported is reflected in a decrease in the reporting rate from 3.6 to 1.3. Reported from 8 sites with the majority from JWNR, FSP and MFNR. Regular records from Lakes Rd, LGeo GrR12 and WBPD GrI11. Maximum number 151/17 Jun Farm Dam, Lakes Rd GrR12 (AnF1), mean 7.3, median 3. Very few spring records (1.7%) with 56% of records from the autumn months.
Abundance
Abundance is the average number of birds of that species per survey. Where the species was observed (presence recorded) but the number of birds seen was not recorded, this is treated as a count of zero.
Abundance by year
This chart shows the abundance of Freckled Duck between 1982 and 2017. 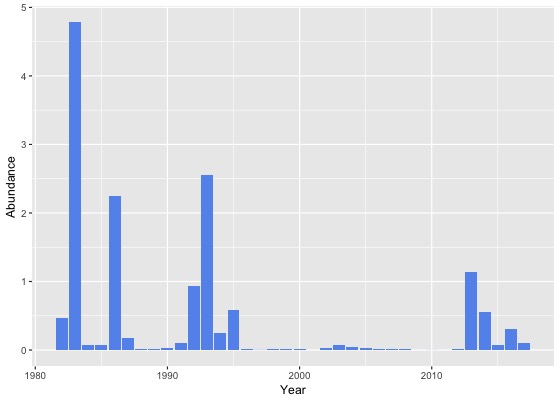
Abundance by month
This chart shows the monthly abundance of Freckled Duck. The blue lines show the abundance for the twelve months to June 2017 and the bars show the average abundance for the period 1982 to 2017. 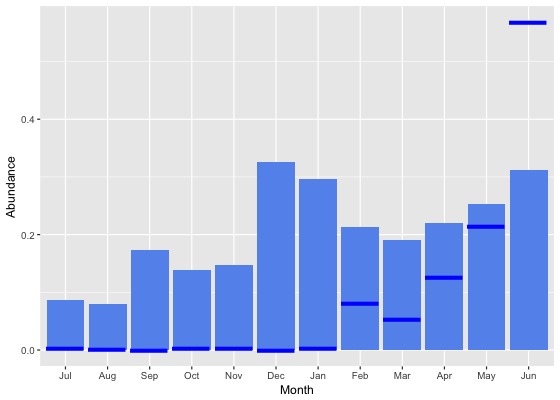
Abundance by season
This chart shows the seasonal abundance of Freckled Duck. The blue lines show the seasonal abundance for the twelve months to June 2017 and the bars show the average seasonal abundance for the period 1982 to 2017. 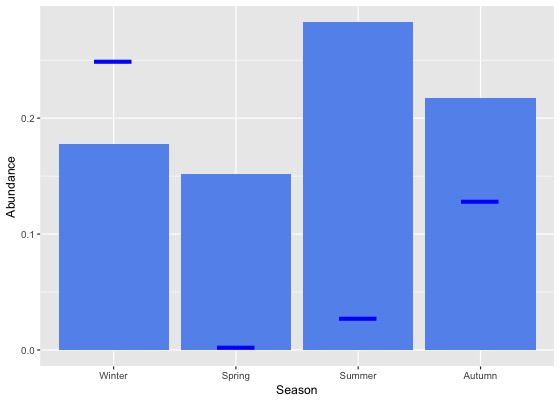
Abundance data
| Month | Season | ||||||||||||||||||
|---|---|---|---|---|---|---|---|---|---|---|---|---|---|---|---|---|---|---|---|
| Period | Jul | Aug | Sep | Oct | Nov | Dec | Jan | Feb | Mar | Apr | May | Jun | Winter | Spring | Summer | Autumn | All | ||
| All years | |||||||||||||||||||
| All | 0.1 | 0.1 | 0.2 | 0.1 | 0.1 | 0.3 | 0.3 | 0.2 | 0.2 | 0.2 | 0.3 | 0.3 | 0.2 | 0.2 | 0.3 | 0.2 | 0.2 | ||
| Previous years | |||||||||||||||||||
| All previous years | 0.1 | 0.1 | 0.2 | 0.2 | 0.2 | 0.4 | 0.4 | 0.2 | 0.2 | 0.2 | 0.3 | 0.3 | 0.2 | 0.2 | 0.3 | 0.2 | 0.2 | ||
| Previous 30 years | 0.1 | 0.1 | 0.2 | 0.2 | 0.2 | 0.4 | 0.3 | 0.2 | 0.2 | 0.2 | 0.2 | 0.2 | 0.2 | 0.2 | 0.3 | 0.2 | 0.2 | ||
| Previous 20 years | 0.1 | 0.1 | 0.2 | 0.1 | 0.2 | 0.4 | 0.3 | 0.2 | 0.2 | 0.2 | 0.1 | 0.0 | 0.1 | 0.2 | 0.3 | 0.2 | 0.2 | ||
| 10 year groups | |||||||||||||||||||
| [2007,2017) | 0.1 | 0.1 | 0.3 | 0.2 | 0.2 | 0.5 | 0.4 | 0.3 | 0.4 | 0.3 | 0.1 | 0.0 | 0.1 | 0.2 | 0.4 | 0.3 | 0.3 | ||
| [1997,2007) | 0.0 | 0.0 | 0.0 | 0.0 | 0.1 | 0.0 | 0.1 | 0.0 | 0.0 | 0.0 | 0.0 | 0.0 | 0.0 | 0.0 | 0.0 | 0.0 | 0.0 | ||
| [1987,1997) | 0.2 | 0.1 | 0.1 | 0.2 | 0.1 | 0.5 | 0.3 | 0.1 | 0.1 | 0.1 | 0.7 | 1.3 | 0.5 | 0.1 | 0.3 | 0.3 | 0.3 | ||
| 5 year groups | |||||||||||||||||||
| [2012,2017) | 0.1 | 0.1 | 0.5 | 0.3 | 0.3 | 0.8 | 0.5 | 0.4 | 0.5 | 0.4 | 0.2 | 0.1 | 0.1 | 0.3 | 0.6 | 0.4 | 0.4 | ||
| [2007,2012) | 0.0 | 0.0 | 0.0 | 0.0 | 0.0 | 0.0 | 0.0 | 0.0 | 0.0 | 0.0 | 0.0 | 0.0 | 0.0 | 0.0 | 0.0 | 0.0 | 0.0 | ||
| [2002,2007) | 0.0 | 0.1 | 0.0 | 0.1 | 0.1 | 0.0 | 0.1 | 0.0 | 0.0 | 0.0 | 0.0 | 0.0 | 0.0 | 0.0 | 0.1 | 0.0 | 0.0 | ||
| [1997,2002) | 0.0 | 0.0 | 0.0 | 0.0 | 0.0 | 0.0 | 0.0 | 0.0 | 0.0 | 0.0 | 0.0 | 0.0 | 0.0 | 0.0 | 0.0 | 0.0 | 0.0 | ||
| [1992,1997) | 0.6 | 0.2 | 0.0 | 0.5 | 0.2 | 1.3 | 0.6 | 0.2 | 0.1 | 0.0 | 2.1 | 3.6 | 1.5 | 0.3 | 0.7 | 0.7 | 0.8 | ||
| [1987,1992) | 0.0 | 0.1 | 0.1 | 0.0 | 0.1 | 0.1 | 0.2 | 0.1 | 0.0 | 0.1 | 0.0 | 0.0 | 0.0 | 0.1 | 0.1 | 0.1 | 0.1 | ||
| Year | |||||||||||||||||||
| 2017 | 0.0 | 0.0 | 0.0 | 0.0 | 0.0 | 0.0 | 0.0 | 0.1 | 0.1 | 0.1 | 0.2 | 0.6 | 0.2 | 0.0 | 0.0 | 0.1 | 0.1 | ||
| 2016 | 0.0 | 0.0 | 0.0 | 0.0 | 0.2 | 0.4 | 0.5 | 0.5 | 0.6 | 0.8 | 0.2 | 0.0 | 0.0 | 0.1 | 0.5 | 0.6 | 0.3 | ||
| 2015 | 0.1 | 0.1 | 0.0 | 0.0 | 0.1 | 0.2 | 0.2 | 0.1 | 0.1 | 0.0 | 0.1 | 0.0 | 0.1 | 0.0 | 0.1 | 0.1 | 0.1 | ||
| 2014 | 0.4 | 0.7 | 1.1 | 1.3 | 0.7 | 0.2 | 0.6 | 0.5 | 0.2 | 0.1 | 0.1 | 0.0 | 0.3 | 1.1 | 0.5 | 0.1 | 0.6 | ||
| 2013 | 0.4 | 0.0 | 2.3 | 0.4 | 0.9 | 2.8 | 1.7 | 0.8 | 1.5 | 0.2 | 0.4 | 0.2 | 0.2 | 1.1 | 1.9 | 0.8 | 1.1 | ||
| 2012 | 0.0 | 0.0 | 0.0 | 0.0 | 0.0 | 0.1 | 0.0 | 0.0 | 0.0 | 0.0 | 0.0 | 0.0 | 0.0 | 0.0 | 0.0 | 0.0 | 0.0 | ||
| 2011 | 0.0 | 0.0 | 0.0 | 0.0 | 0.0 | 0.0 | 0.0 | 0.0 | 0.0 | 0.0 | 0.0 | 0.0 | 0.0 | 0.0 | 0.0 | 0.0 | 0.0 | ||
| 2010 | 0.0 | 0.0 | 0.0 | 0.0 | 0.0 | 0.0 | 0.0 | 0.0 | 0.0 | 0.0 | 0.0 | 0.0 | 0.0 | 0.0 | 0.0 | 0.0 | 0.0 | ||
| 2009 | 0.0 | 0.0 | 0.0 | 0.0 | 0.0 | 0.0 | 0.0 | 0.0 | 0.0 | 0.0 | 0.0 | 0.0 | 0.0 | 0.0 | 0.0 | 0.0 | 0.0 | ||
| 2008 | 0.0 | 0.0 | 0.0 | 0.0 | 0.2 | 0.0 | 0.1 | 0.0 | 0.0 | 0.0 | 0.0 | 0.0 | 0.0 | 0.0 | 0.0 | 0.0 | 0.0 | ||
| 2007 | 0.2 | 0.0 | 0.0 | 0.0 | 0.0 | 0.0 | 0.0 | 0.0 | 0.0 | 0.0 | 0.0 | 0.0 | 0.0 | 0.0 | 0.0 | 0.0 | 0.0 | ||
| 2006 | 0.0 | 0.0 | 0.0 | 0.0 | 0.0 | 0.0 | 0.0 | 0.0 | 0.0 | 0.0 | 0.0 | 0.0 | 0.0 | 0.0 | 0.0 | 0.0 | 0.0 | ||
| 2005 | 0.0 | 0.0 | 0.0 | 0.0 | 0.1 | 0.1 | 0.0 | 0.0 | 0.1 | 0.0 | 0.0 | 0.0 | 0.0 | 0.0 | 0.0 | 0.0 | 0.0 | ||
| 2004 | 0.1 | 0.2 | 0.0 | 0.2 | 0.1 | 0.0 | 0.0 | 0.0 | 0.0 | 0.0 | 0.0 | 0.0 | 0.1 | 0.1 | 0.0 | 0.0 | 0.1 | ||
| 2003 | 0.1 | 0.1 | 0.0 | 0.1 | 0.1 | 0.1 | 0.6 | 0.0 | 0.0 | 0.0 | 0.1 | 0.0 | 0.1 | 0.0 | 0.2 | 0.0 | 0.1 | ||
| 2002 | 0.0 | 0.0 | 0.0 | 0.1 | 0.0 | 0.0 | 0.0 | 0.0 | 0.0 | 0.1 | 0.0 | 0.0 | 0.0 | 0.0 | 0.0 | 0.0 | 0.0 | ||
| 2001 | 0.0 | 0.0 | 0.0 | 0.0 | 0.0 | 0.0 | 0.0 | 0.0 | 0.0 | 0.0 | 0.0 | 0.0 | 0.0 | 0.0 | 0.0 | 0.0 | 0.0 | ||
| 2000 | 0.0 | 0.0 | 0.0 | 0.0 | 0.1 | 0.0 | 0.0 | 0.0 | 0.0 | 0.0 | 0.0 | 0.0 | 0.0 | 0.0 | 0.0 | 0.0 | 0.0 | ||
| 1999 | 0.0 | 0.0 | 0.0 | 0.0 | 0.0 | 0.0 | 0.0 | 0.0 | 0.0 | 0.0 | 0.0 | 0.1 | 0.0 | 0.0 | 0.0 | 0.0 | 0.0 | ||
| 1998 | 0.0 | 0.0 | 0.0 | 0.0 | 0.0 | 0.0 | 0.0 | 0.0 | 0.0 | 0.0 | 0.0 | 0.1 | 0.0 | 0.0 | 0.0 | 0.0 | 0.0 | ||
| 1997 | 0.0 | 0.0 | 0.0 | 0.0 | 0.0 | 0.0 | 0.0 | 0.1 | 0.0 | 0.0 | 0.0 | 0.0 | 0.0 | 0.0 | 0.0 | 0.0 | 0.0 | ||
| 1996 | 0.0 | 0.0 | 0.0 | 0.0 | 0.0 | 0.0 | 0.0 | 0.0 | 0.1 | 0.0 | 0.0 | 0.1 | 0.0 | 0.0 | 0.0 | 0.1 | 0.0 | ||
| 1995 | 1.1 | 0.5 | 0.0 | 0.5 | 0.8 | 3.6 | 0.9 | 0.0 | 0.0 | 0.0 | 0.0 | 0.0 | 0.5 | 0.4 | 1.6 | 0.0 | 0.6 | ||
| 1994 | 1.6 | 0.2 | 0.1 | 0.0 | 0.0 | 0.1 | 1.0 | 0.0 | 0.0 | 0.0 | 0.1 | 0.7 | 0.7 | 0.0 | 0.4 | 0.0 | 0.3 | ||
| 1993 | 0.2 | 0.3 | 0.0 | 1.8 | 0.0 | 0.1 | 0.1 | 0.0 | 0.0 | 0.0 | 9.5 | 14.4 | 5.2 | 0.7 | 0.1 | 3.4 | 2.6 | ||
| 1992 | 0.0 | 0.0 | 0.0 | 0.6 | 0.1 | 2.0 | 1.0 | 1.1 | 0.3 | 0.3 | 0.4 | 6.4 | 2.1 | 0.3 | 1.4 | 0.3 | 0.9 | ||
| 1991 | 0.0 | 0.0 | 0.0 | 0.0 | 0.0 | 0.0 | 0.4 | 0.0 | 0.0 | 0.9 | 0.3 | 0.0 | 0.0 | 0.0 | 0.1 | 0.4 | 0.1 | ||
| 1990 | 0.0 | 0.0 | 0.0 | 0.0 | 0.0 | 0.0 | 0.0 | 0.2 | 0.1 | 0.0 | 0.0 | 0.0 | 0.0 | 0.0 | 0.1 | 0.0 | 0.0 | ||
| 1989 | 0.0 | 0.0 | 0.0 | 0.0 | 0.0 | 0.0 | 0.0 | 0.1 | 0.0 | 0.0 | 0.0 | 0.0 | 0.0 | 0.0 | 0.0 | 0.0 | 0.0 | ||
| 1988 | 0.0 | 0.0 | 0.0 | 0.0 | 0.0 | 0.0 | 0.0 | 0.0 | 0.0 | 0.1 | 0.0 | 0.0 | 0.0 | 0.0 | 0.0 | 0.0 | 0.0 | ||
| 1987 | 1.1 | 3.3 | 0.2 | 0.2 | 0.3 | 0.3 | 0.4 | 0.0 | 0.0 | 0.0 | 0.0 | 0.0 | 0.3 | 0.2 | 0.3 | 0.0 | 0.2 | ||
| 1986 | 0.0 | 0.0 | 0.0 | 1.2 | 0.1 | 1.1 | 0.8 | 2.0 | 0.0 | 9.6 | 6.3 | 3.9 | 1.4 | 0.4 | 1.4 | 6.1 | 2.2 | ||
| 1985 | 0.0 | 0.0 | 0.0 | 0.1 | 0.0 | 0.0 | 0.1 | 0.5 | 0.7 | 0.0 | 0.4 | 0.0 | 0.0 | 0.0 | 0.1 | 0.3 | 0.1 | ||
| 1984 | 0.0 | 0.0 | 0.0 | 0.0 | 0.0 | 0.0 | 0.3 | 0.0 | 0.0 | 0.0 | 0.2 | 0.0 | 0.0 | 0.0 | 0.1 | 0.1 | 0.1 | ||
| 1983 | 4.7 | 5.8 | 1.8 | 3.1 | 4.4 | 1.2 | 15.5 | 12.8 | 8.5 | - | 2.1 | 0.0 | 3.3 | 3.3 | 8.3 | 3.0 | 4.8 | ||
| 1982 | - | 0.0 | - | 0.0 | 0.1 | 0.0 | - | 0.9 | - | 0.0 | - | 1.6 | 0.9 | 0.1 | 0.4 | 0.0 | 0.5 | ||
Reporting rates
Reporting rate is the proportion of all surveys in which the species was present.
Reporting rate by year
This chart shows the reporting rate of Freckled Duck each year between 1982 and 2017. 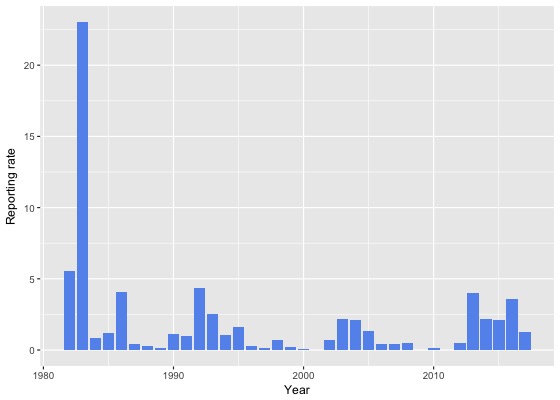
Reporting rate by month
This chart shows the reporting rate by month of Freckled Duck. The blue lines show the reporting rate for the twelve months to June 2017 and the bars show the average reporting rate for the period 1982 to 2017. 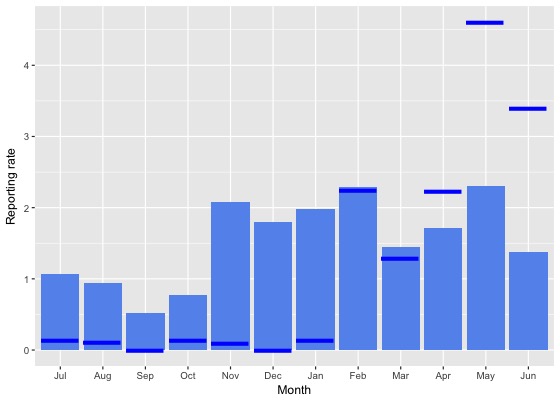
Reporting rate by season
This chart shows the seasonal reporting rate of Freckled Duck. The blue lines show the seasonal reporting rate for the twelve months to June 2017 and the bars show the average seasonal reporting rate for the period 1982 to 2017. 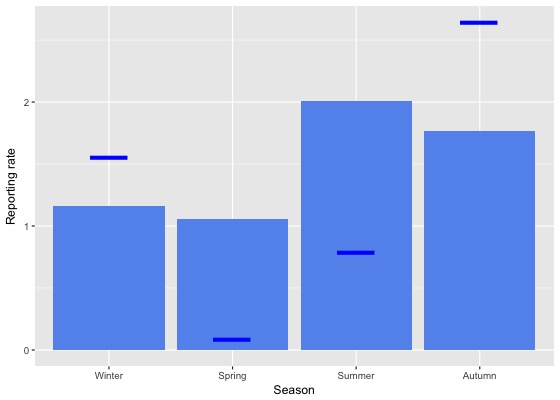
Reporting rate data
| Month | Season | ||||||||||||||||||
|---|---|---|---|---|---|---|---|---|---|---|---|---|---|---|---|---|---|---|---|
| Period | Jul | Aug | Sep | Oct | Nov | Dec | Jan | Feb | Mar | Apr | May | Jun | Winter | Spring | Summer | Autumn | All | ||
| All years | |||||||||||||||||||
| All | 1.1 | 0.9 | 0.5 | 0.8 | 2.1 | 1.8 | 2.0 | 2.3 | 1.4 | 1.7 | 2.3 | 1.4 | 1.2 | 1.1 | 2.0 | 1.8 | 1.5 | ||
| Previous years | |||||||||||||||||||
| All previous years | 1.2 | 1.1 | 0.6 | 0.9 | 2.4 | 2.1 | 2.3 | 2.3 | 1.5 | 1.6 | 1.8 | 1.0 | 1.1 | 1.2 | 2.2 | 1.6 | 1.5 | ||
| Previous 30 years | 1.2 | 1.1 | 0.6 | 0.8 | 2.4 | 2.0 | 2.3 | 2.2 | 1.4 | 1.6 | 1.7 | 0.9 | 1.0 | 1.2 | 2.2 | 1.6 | 1.5 | ||
| Previous 20 years | 1.2 | 1.2 | 0.7 | 0.8 | 3.0 | 2.2 | 2.3 | 2.5 | 1.5 | 1.7 | 2.0 | 0.9 | 1.1 | 1.3 | 2.3 | 1.7 | 1.6 | ||
| 10 year groups | |||||||||||||||||||
| [2007,2017) | 1.6 | 0.9 | 0.8 | 0.7 | 3.5 | 2.9 | 2.7 | 3.2 | 2.1 | 2.3 | 2.7 | 1.0 | 1.1 | 1.4 | 2.9 | 2.3 | 2.0 | ||
| [1997,2007) | 0.6 | 1.8 | 0.5 | 1.3 | 2.0 | 1.0 | 0.9 | 0.5 | 0.1 | 0.4 | 0.3 | 0.5 | 0.9 | 1.2 | 0.8 | 0.2 | 0.8 | ||
| [1987,1997) | 1.1 | 0.7 | 0.2 | 0.6 | 0.3 | 1.1 | 2.0 | 1.1 | 1.2 | 1.0 | 0.6 | 1.3 | 1.0 | 0.4 | 1.4 | 1.0 | 0.9 | ||
| 5 year groups | |||||||||||||||||||
| [2012,2017) | 1.9 | 1.2 | 1.0 | 1.0 | 4.4 | 4.2 | 3.3 | 4.0 | 2.9 | 3.3 | 3.6 | 1.6 | 1.5 | 1.9 | 3.8 | 3.2 | 2.7 | ||
| [2007,2012) | 0.7 | 0.0 | 0.2 | 0.1 | 0.9 | 0.1 | 0.6 | 0.2 | 0.0 | 0.0 | 0.0 | 0.1 | 0.2 | 0.3 | 0.3 | 0.0 | 0.2 | ||
| [2002,2007) | 0.8 | 3.4 | 0.9 | 2.2 | 3.4 | 1.6 | 1.7 | 0.8 | 0.2 | 0.5 | 0.5 | 0.4 | 1.3 | 2.1 | 1.4 | 0.4 | 1.3 | ||
| [1997,2002) | 0.2 | 0.0 | 0.0 | 0.0 | 0.3 | 0.3 | 0.0 | 0.2 | 0.0 | 0.1 | 0.0 | 0.7 | 0.3 | 0.1 | 0.2 | 0.0 | 0.1 | ||
| [1992,1997) | 2.8 | 1.4 | 0.3 | 1.5 | 0.8 | 2.9 | 4.1 | 1.1 | 1.8 | 0.9 | 1.6 | 3.0 | 2.3 | 0.9 | 2.9 | 1.4 | 1.8 | ||
| [1987,1992) | 0.4 | 0.3 | 0.2 | 0.1 | 0.1 | 0.3 | 0.8 | 1.1 | 0.8 | 1.0 | 0.1 | 0.3 | 0.3 | 0.1 | 0.7 | 0.7 | 0.4 | ||
| Year | |||||||||||||||||||
| 2017 | 0.1 | 0.1 | 0.0 | 0.1 | 0.1 | 0.0 | 0.1 | 2.2 | 1.3 | 2.2 | 4.6 | 3.4 | 1.6 | 0.1 | 0.8 | 2.6 | 1.3 | ||
| 2016 | 2.2 | 0.5 | 0.6 | 1.0 | 4.8 | 4.8 | 4.8 | 5.5 | 4.4 | 6.5 | 5.5 | 0.7 | 1.1 | 1.8 | 5.0 | 5.4 | 3.6 | ||
| 2015 | 2.1 | 2.2 | 1.2 | 0.9 | 2.4 | 4.6 | 3.1 | 2.3 | 1.6 | 0.8 | 2.5 | 1.9 | 2.0 | 1.4 | 3.3 | 1.5 | 2.1 | ||
| 2014 | 4.2 | 2.9 | 2.1 | 1.3 | 1.1 | 2.1 | 3.3 | 3.9 | 1.8 | 1.0 | 1.1 | 2.1 | 2.8 | 1.5 | 3.2 | 1.4 | 2.2 | ||
| 2013 | 0.9 | 0.9 | 1.0 | 2.1 | 11.8 | 4.6 | 4.0 | 4.7 | 4.2 | 3.5 | 5.4 | 4.3 | 2.2 | 4.4 | 4.4 | 4.2 | 4.0 | ||
| 2012 | 0.0 | 0.0 | 0.5 | 0.3 | 1.9 | 2.4 | 0.0 | 0.5 | 0.0 | 0.0 | 0.0 | 0.0 | 0.0 | 0.7 | 0.9 | 0.0 | 0.5 | ||
| 2011 | 0.0 | 0.0 | 0.0 | 0.0 | 0.0 | 0.0 | 0.0 | 0.0 | 0.0 | 0.0 | 0.0 | 0.0 | 0.0 | 0.0 | 0.0 | 0.0 | 0.0 | ||
| 2010 | 0.0 | 0.0 | 1.1 | 0.0 | 0.0 | 0.0 | 0.0 | 0.0 | 0.0 | 0.0 | 0.0 | 0.0 | 0.0 | 0.3 | 0.0 | 0.0 | 0.1 | ||
| 2009 | 0.0 | 0.0 | 0.0 | 0.0 | 0.0 | 0.0 | 0.0 | 0.0 | 0.0 | 0.0 | 0.0 | 0.0 | 0.0 | 0.0 | 0.0 | 0.0 | 0.0 | ||
| 2008 | 0.0 | 0.0 | 0.0 | 0.3 | 4.0 | 0.0 | 2.4 | 0.9 | 0.0 | 0.0 | 0.0 | 0.5 | 0.2 | 0.8 | 0.9 | 0.0 | 0.5 | ||
| 2007 | 4.4 | 0.0 | 0.0 | 0.2 | 1.4 | 0.3 | 1.2 | 0.0 | 0.0 | 0.0 | 0.0 | 0.0 | 0.8 | 0.4 | 0.6 | 0.0 | 0.4 | ||
| 2006 | 1.3 | 1.0 | 0.0 | 0.0 | 0.0 | 0.6 | 1.1 | 0.0 | 0.0 | 1.1 | 0.0 | 0.8 | 1.0 | 0.0 | 0.6 | 0.3 | 0.4 | ||
| 2005 | 0.0 | 0.0 | 0.0 | 0.0 | 6.9 | 2.8 | 4.3 | 2.2 | 1.3 | 0.0 | 0.0 | 0.8 | 0.4 | 1.7 | 3.1 | 0.5 | 1.4 | ||
| 2004 | 1.2 | 8.6 | 2.9 | 7.0 | 5.2 | 0.0 | 0.0 | 1.0 | 0.0 | 0.0 | 0.0 | 0.0 | 2.8 | 4.9 | 0.2 | 0.0 | 2.1 | ||
| 2003 | 1.7 | 4.3 | 1.3 | 4.1 | 5.0 | 3.0 | 3.0 | 0.5 | 0.0 | 0.9 | 2.3 | 0.0 | 1.9 | 3.4 | 2.2 | 0.9 | 2.2 | ||
| 2002 | 0.0 | 0.8 | 0.5 | 2.6 | 0.5 | 1.2 | 0.6 | 0.7 | 0.0 | 0.6 | 0.0 | 0.0 | 0.2 | 1.3 | 0.9 | 0.2 | 0.7 | ||
| 2001 | 0.0 | 0.0 | 0.0 | 0.0 | 0.0 | 0.0 | 0.0 | 0.0 | 0.0 | 0.0 | 0.0 | 0.0 | 0.0 | 0.0 | 0.0 | 0.0 | 0.0 | ||
| 2000 | 0.0 | 0.0 | 0.0 | 0.0 | 0.5 | 0.3 | 0.0 | 0.0 | 0.0 | 0.0 | 0.0 | 0.0 | 0.0 | 0.2 | 0.1 | 0.0 | 0.1 | ||
| 1999 | 2.9 | 0.0 | 0.0 | 0.0 | 0.0 | 0.0 | 0.0 | 0.0 | 0.0 | 0.5 | 0.0 | 0.9 | 0.9 | 0.0 | 0.0 | 0.2 | 0.2 | ||
| 1998 | 0.0 | 0.0 | 0.0 | 0.0 | 0.9 | 1.9 | 0.0 | 0.0 | 0.0 | 0.0 | 0.0 | 4.0 | 1.8 | 0.3 | 0.9 | 0.0 | 0.7 | ||
| 1997 | 0.0 | 0.0 | 0.0 | 0.0 | 0.0 | 0.0 | 0.0 | 1.8 | 0.0 | 0.0 | 0.0 | 0.0 | 0.0 | 0.0 | 0.5 | 0.0 | 0.1 | ||
| 1996 | 0.0 | 0.0 | 0.0 | 0.0 | 0.0 | 0.0 | 0.0 | 0.0 | 1.0 | 1.6 | 0.0 | 1.1 | 0.4 | 0.0 | 0.0 | 0.9 | 0.3 | ||
| 1995 | 5.4 | 0.8 | 0.0 | 1.2 | 1.8 | 5.7 | 4.4 | 0.0 | 0.0 | 0.0 | 0.0 | 0.0 | 1.9 | 1.1 | 3.8 | 0.0 | 1.6 | ||
| 1994 | 2.0 | 1.3 | 1.5 | 0.0 | 0.0 | 2.2 | 4.4 | 0.0 | 0.0 | 0.0 | 2.5 | 1.1 | 1.4 | 0.3 | 2.3 | 0.7 | 1.0 | ||
| 1993 | 6.1 | 5.1 | 0.0 | 5.3 | 0.0 | 2.2 | 2.0 | 0.0 | 0.0 | 0.0 | 2.6 | 5.8 | 5.6 | 2.0 | 1.6 | 0.9 | 2.6 | ||
| 1992 | 0.0 | 0.0 | 0.0 | 2.1 | 2.8 | 4.8 | 12.1 | 7.3 | 9.9 | 5.1 | 2.6 | 10.0 | 3.4 | 1.6 | 8.0 | 5.8 | 4.4 | ||
| 1991 | 0.0 | 0.0 | 0.0 | 0.0 | 0.0 | 0.0 | 5.4 | 2.0 | 0.0 | 6.8 | 1.6 | 0.0 | 0.0 | 0.0 | 2.2 | 2.7 | 1.0 | ||
| 1990 | 0.0 | 0.0 | 1.1 | 0.0 | 0.0 | 0.0 | 2.8 | 5.6 | 2.3 | 3.6 | 0.0 | 1.3 | 0.2 | 0.3 | 2.8 | 2.0 | 1.1 | ||
| 1989 | 0.0 | 0.0 | 0.0 | 0.0 | 0.0 | 0.0 | 0.0 | 0.5 | 1.1 | 0.0 | 0.0 | 0.0 | 0.0 | 0.0 | 0.2 | 0.4 | 0.1 | ||
| 1988 | 0.9 | 0.4 | 0.0 | 0.0 | 0.0 | 0.5 | 0.0 | 0.6 | 0.5 | 0.5 | 0.0 | 0.0 | 0.4 | 0.0 | 0.4 | 0.3 | 0.3 | ||
| 1987 | 9.1 | 6.7 | 0.4 | 0.4 | 0.3 | 0.5 | 0.5 | 0.4 | 0.5 | 0.0 | 0.0 | 0.5 | 1.3 | 0.4 | 0.5 | 0.1 | 0.4 | ||
| 1986 | 0.0 | 0.0 | 0.0 | 5.6 | 4.3 | 5.9 | 4.3 | 5.6 | 3.2 | 5.9 | 6.9 | 8.6 | 3.0 | 2.9 | 5.4 | 5.4 | 4.1 | ||
| 1985 | 0.0 | 0.0 | 0.0 | 1.2 | 0.0 | 0.0 | 12.5 | 5.9 | 9.1 | 0.0 | 10.0 | 0.0 | 0.0 | 0.5 | 2.4 | 5.0 | 1.2 | ||
| 1984 | 0.0 | 0.0 | 0.0 | 0.0 | 0.0 | 0.0 | 3.4 | 0.0 | 0.0 | 0.0 | 3.2 | 0.0 | 0.0 | 0.0 | 1.4 | 1.1 | 0.8 | ||
| 1983 | 33.3 | 25.0 | 20.0 | 30.8 | 11.1 | 23.1 | 66.7 | 18.2 | 100.0 | - | 8.3 | 0.0 | 17.2 | 22.2 | 30.0 | 21.4 | 23.0 | ||
| 1982 | - | 0.0 | - | 0.0 | 12.5 | 0.0 | - | 18.2 | - | 0.0 | - | 7.1 | 4.0 | 11.1 | 8.0 | 0.0 | 5.6 | ||
Breeding data
Breeding records by month
Number of breeding records by breeding code and month, 2017 and all years| Breeding code | Jul | Aug | Sep | Oct | Nov | Dec | Jan | Feb | Mar | Apr | May | Jun |
|---|---|---|---|---|---|---|---|---|---|---|---|---|
| 2017 | ||||||||||||
| Breeding (BLA code) | 0 | 0 | 0 | 0 | 0 | 0 | 0 | 0 | 0 | 0 | 0 | 0 |
| Carrying Food | 0 | 0 | 0 | 0 | 0 | 0 | 0 | 0 | 0 | 0 | 0 | 0 |
| Copulating | 0 | 0 | 0 | 0 | 0 | 0 | 0 | 0 | 0 | 0 | 0 | 0 |
| Display | 0 | 0 | 0 | 0 | 0 | 0 | 0 | 0 | 0 | 0 | 0 | 0 |
| Dependent young | 0 | 0 | 0 | 0 | 0 | 0 | 0 | 0 | 0 | 0 | 0 | 0 |
| Faecal sac | 0 | 0 | 0 | 0 | 0 | 0 | 0 | 0 | 0 | 0 | 0 | 0 |
| Inspecting hollow | 0 | 0 | 0 | 0 | 0 | 0 | 0 | 0 | 0 | 0 | 0 | 0 |
| Nest building | 0 | 0 | 0 | 0 | 0 | 0 | 0 | 0 | 0 | 0 | 0 | 0 |
| Nest with eggs | 0 | 0 | 0 | 0 | 0 | 0 | 0 | 0 | 0 | 0 | 0 | 0 |
| Nest with young | 0 | 0 | 0 | 0 | 0 | 0 | 0 | 0 | 0 | 0 | 0 | 0 |
| On/leaving nest | 0 | 0 | 0 | 0 | 0 | 0 | 0 | 0 | 0 | 0 | 0 | 0 |
| All years | ||||||||||||
| Breeding (BLA code) | 0 | 0 | 0 | 0 | 0 | 0 | 0 | 0 | 0 | 0 | 0 | 0 |
| Carrying Food | 0 | 0 | 0 | 0 | 0 | 0 | 0 | 0 | 0 | 0 | 0 | 0 |
| Copulating | 0 | 0 | 0 | 0 | 0 | 0 | 0 | 0 | 0 | 0 | 0 | 0 |
| Display | 0 | 0 | 0 | 0 | 0 | 0 | 0 | 0 | 0 | 0 | 0 | 0 |
| Dependent young | 0 | 0 | 0 | 0 | 0 | 0 | 0 | 0 | 0 | 0 | 0 | 0 |
| Faecal sac | 0 | 0 | 0 | 0 | 0 | 0 | 0 | 0 | 0 | 0 | 0 | 0 |
| Inspecting hollow | 0 | 0 | 0 | 0 | 0 | 0 | 0 | 0 | 0 | 0 | 0 | 0 |
| Nest building | 0 | 0 | 0 | 0 | 0 | 0 | 0 | 0 | 0 | 0 | 0 | 0 |
| Nest with eggs | 0 | 0 | 0 | 0 | 0 | 0 | 0 | 0 | 0 | 0 | 0 | 0 |
| Nest with young | 0 | 0 | 0 | 0 | 0 | 0 | 0 | 0 | 0 | 0 | 0 | 0 |
| On/leaving nest | 0 | 0 | 0 | 0 | 0 | 0 | 0 | 0 | 0 | 0 | 0 | 0 |
Breeding records by year
Average number of breeding records per period by breeding code| Period | Breeding (BLA code) | Carrying Food | Copulating | Display | Dependent young | Faecal sac | Inspecting hollow | Nest building | Nest with eggs | Nest with young | On/leaving nest |
|---|---|---|---|---|---|---|---|---|---|---|---|
| All years | |||||||||||
| All | 0.0 | 0.0 | 0.0 | 0.0 | 0.0 | 0.0 | 0.0 | 0.0 | 0.0 | 0.0 | 0.0 |
| Previous years | |||||||||||
| All previous years | 0.0 | 0.0 | 0.0 | 0.0 | 0.0 | 0.0 | 0.0 | 0.0 | 0.0 | 0.0 | 0.0 |
| Previous 30 years | 0.0 | 0.0 | 0.0 | 0.0 | 0.0 | 0.0 | 0.0 | 0.0 | 0.0 | 0.0 | 0.0 |
| Previous 20 years | 0.0 | 0.0 | 0.0 | 0.0 | 0.0 | 0.0 | 0.0 | 0.0 | 0.0 | 0.0 | 0.0 |
| 10 year groups | |||||||||||
| [2007,2017) | 0.0 | 0.0 | 0.0 | 0.0 | 0.0 | 0.0 | 0.0 | 0.0 | 0.0 | 0.0 | 0.0 |
| [1997,2007) | 0.0 | 0.0 | 0.0 | 0.0 | 0.0 | 0.0 | 0.0 | 0.0 | 0.0 | 0.0 | 0.0 |
| [1987,1997) | 0.0 | 0.0 | 0.0 | 0.0 | 0.0 | 0.0 | 0.0 | 0.0 | 0.0 | 0.0 | 0.0 |
| 5 year groups | |||||||||||
| [2012,2017) | 0.0 | 0.0 | 0.0 | 0.0 | 0.0 | 0.0 | 0.0 | 0.0 | 0.0 | 0.0 | 0.0 |
| [2007,2012) | 0.0 | 0.0 | 0.0 | 0.0 | 0.0 | 0.0 | 0.0 | 0.0 | 0.0 | 0.0 | 0.0 |
| [2002,2007) | 0.0 | 0.0 | 0.0 | 0.0 | 0.0 | 0.0 | 0.0 | 0.0 | 0.0 | 0.0 | 0.0 |
| [1997,2002) | 0.0 | 0.0 | 0.0 | 0.0 | 0.0 | 0.0 | 0.0 | 0.0 | 0.0 | 0.0 | 0.0 |
| [1992,1997) | 0.0 | 0.0 | 0.0 | 0.0 | 0.0 | 0.0 | 0.0 | 0.0 | 0.0 | 0.0 | 0.0 |
| [1987,1992) | 0.0 | 0.0 | 0.0 | 0.0 | 0.0 | 0.0 | 0.0 | 0.0 | 0.0 | 0.0 | 0.0 |
| Year | |||||||||||
| 2017 | 0.0 | 0.0 | 0.0 | 0.0 | 0.0 | 0.0 | 0.0 | 0.0 | 0.0 | 0.0 | 0.0 |
| 2016 | 0.0 | 0.0 | 0.0 | 0.0 | 0.0 | 0.0 | 0.0 | 0.0 | 0.0 | 0.0 | 0.0 |
| 2015 | 0.0 | 0.0 | 0.0 | 0.0 | 0.0 | 0.0 | 0.0 | 0.0 | 0.0 | 0.0 | 0.0 |
| 2014 | 0.0 | 0.0 | 0.0 | 0.0 | 0.0 | 0.0 | 0.0 | 0.0 | 0.0 | 0.0 | 0.0 |
| 2013 | 0.0 | 0.0 | 0.0 | 0.0 | 0.0 | 0.0 | 0.0 | 0.0 | 0.0 | 0.0 | 0.0 |
| 2012 | 0.0 | 0.0 | 0.0 | 0.0 | 0.0 | 0.0 | 0.0 | 0.0 | 0.0 | 0.0 | 0.0 |
| 2011 | 0.0 | 0.0 | 0.0 | 0.0 | 0.0 | 0.0 | 0.0 | 0.0 | 0.0 | 0.0 | 0.0 |
| 2010 | 0.0 | 0.0 | 0.0 | 0.0 | 0.0 | 0.0 | 0.0 | 0.0 | 0.0 | 0.0 | 0.0 |
| 2009 | 0.0 | 0.0 | 0.0 | 0.0 | 0.0 | 0.0 | 0.0 | 0.0 | 0.0 | 0.0 | 0.0 |
| 2008 | 0.0 | 0.0 | 0.0 | 0.0 | 0.0 | 0.0 | 0.0 | 0.0 | 0.0 | 0.0 | 0.0 |
| 2007 | 0.0 | 0.0 | 0.0 | 0.0 | 0.0 | 0.0 | 0.0 | 0.0 | 0.0 | 0.0 | 0.0 |
| 2006 | 0.0 | 0.0 | 0.0 | 0.0 | 0.0 | 0.0 | 0.0 | 0.0 | 0.0 | 0.0 | 0.0 |
| 2005 | 0.0 | 0.0 | 0.0 | 0.0 | 0.0 | 0.0 | 0.0 | 0.0 | 0.0 | 0.0 | 0.0 |
| 2004 | 0.0 | 0.0 | 0.0 | 0.0 | 0.0 | 0.0 | 0.0 | 0.0 | 0.0 | 0.0 | 0.0 |
| 2003 | 0.0 | 0.0 | 0.0 | 0.0 | 0.0 | 0.0 | 0.0 | 0.0 | 0.0 | 0.0 | 0.0 |
| 2002 | 0.0 | 0.0 | 0.0 | 0.0 | 0.0 | 0.0 | 0.0 | 0.0 | 0.0 | 0.0 | 0.0 |
| 2001 | 0.0 | 0.0 | 0.0 | 0.0 | 0.0 | 0.0 | 0.0 | 0.0 | 0.0 | 0.0 | 0.0 |
| 2000 | 0.0 | 0.0 | 0.0 | 0.0 | 0.0 | 0.0 | 0.0 | 0.0 | 0.0 | 0.0 | 0.0 |
| 1999 | 0.0 | 0.0 | 0.0 | 0.0 | 0.0 | 0.0 | 0.0 | 0.0 | 0.0 | 0.0 | 0.0 |
| 1998 | 0.0 | 0.0 | 0.0 | 0.0 | 0.0 | 0.0 | 0.0 | 0.0 | 0.0 | 0.0 | 0.0 |
| 1997 | 0.0 | 0.0 | 0.0 | 0.0 | 0.0 | 0.0 | 0.0 | 0.0 | 0.0 | 0.0 | 0.0 |
| 1996 | 0.0 | 0.0 | 0.0 | 0.0 | 0.0 | 0.0 | 0.0 | 0.0 | 0.0 | 0.0 | 0.0 |
| 1995 | 0.0 | 0.0 | 0.0 | 0.0 | 0.0 | 0.0 | 0.0 | 0.0 | 0.0 | 0.0 | 0.0 |
| 1994 | 0.0 | 0.0 | 0.0 | 0.0 | 0.0 | 0.0 | 0.0 | 0.0 | 0.0 | 0.0 | 0.0 |
| 1993 | 0.0 | 0.0 | 0.0 | 0.0 | 0.0 | 0.0 | 0.0 | 0.0 | 0.0 | 0.0 | 0.0 |
| 1992 | 0.0 | 0.0 | 0.0 | 0.0 | 0.0 | 0.0 | 0.0 | 0.0 | 0.0 | 0.0 | 0.0 |
| 1991 | 0.0 | 0.0 | 0.0 | 0.0 | 0.0 | 0.0 | 0.0 | 0.0 | 0.0 | 0.0 | 0.0 |
| 1990 | 0.0 | 0.0 | 0.0 | 0.0 | 0.0 | 0.0 | 0.0 | 0.0 | 0.0 | 0.0 | 0.0 |
| 1989 | 0.0 | 0.0 | 0.0 | 0.0 | 0.0 | 0.0 | 0.0 | 0.0 | 0.0 | 0.0 | 0.0 |
| 1988 | 0.0 | 0.0 | 0.0 | 0.0 | 0.0 | 0.0 | 0.0 | 0.0 | 0.0 | 0.0 | 0.0 |
| 1987 | 0.0 | 0.0 | 0.0 | 0.0 | 0.0 | 0.0 | 0.0 | 0.0 | 0.0 | 0.0 | 0.0 |
| 1986 | 0.0 | 0.0 | 0.0 | 0.0 | 0.0 | 0.0 | 0.0 | 0.0 | 0.0 | 0.0 | 0.0 |
| 1985 | 0.0 | 0.0 | 0.0 | 0.0 | 0.0 | 0.0 | 0.0 | 0.0 | 0.0 | 0.0 | 0.0 |
| 1984 | 0.0 | 0.0 | 0.0 | 0.0 | 0.0 | 0.0 | 0.0 | 0.0 | 0.0 | 0.0 | 0.0 |
| 1983 | 0.0 | 0.0 | 0.0 | 0.0 | 0.0 | 0.0 | 0.0 | 0.0 | 0.0 | 0.0 | 0.0 |
| 1982 | 0.0 | 0.0 | 0.0 | 0.0 | 0.0 | 0.0 | 0.0 | 0.0 | 0.0 | 0.0 | 0.0 |
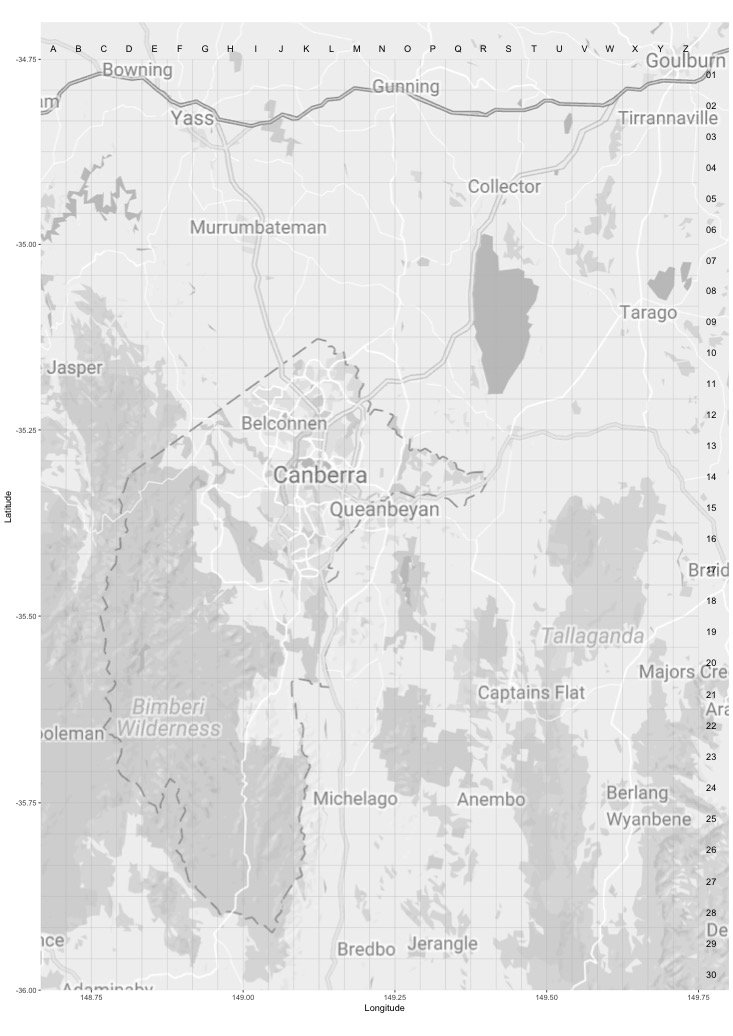
Distribution map
Distribution - 2017
This map shows the observed distribution of the Freckled Duck for 2017.
The red circles are the grid cells where Freckled Duck have been reported.
The transparency of the red circles indicate how many surveys sheets were submitted for that grid cell; the darker the red the more reliable the data. Of the 315 grid cells with reports, 83 had only one sheet; an example is grid number A11.
The size of the circle represents the reporting rate. The maximum reporting rate for Freckled Duck was 14.3% (eg grid number F18) and the minimum was 0.1% (eg grid number J14). 
Distribution - all years
This map shows the observed distribution of the Freckled Duck for all years.
The red circles are the grid cells where Freckled Duck have been reported.
The transparency of the red circles indicate how many surveys sheets were submitted for that grid cell; the darker the red the more reliable the data. Of the 703 grid cells with reports, 55 had only one sheet; an example is grid number A12.
The size of the circle represents the reporting rate. The maximum reporting rate for Freckled Duck was 36.4% (eg grid number T8) and the minimum was 0.0% (eg grid number J12). 
Breeding map
Breeding - 2017
This map shows the breeding distribution of the Freckled Duck for 2017.
The red circles are the grid cells where breeding activity for Freckled Duck have been reported.
The size of the circle represents the number of reports. 
Breeding - all years
This map shows the breeding distribution of the Freckled Duck for all years.
The red circles are the grid cells where breeding activity for Freckled Duck have been reported.
The size of the circle represents the number of reports.